.png)
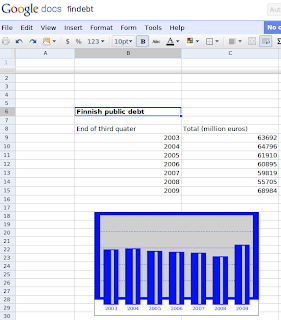
So, let's take an example. Here we want to see how Finnish public debt is evolved through first years of the millenia. We first go local statistical office homepage (http://stat.fi) and look for data. Once we found interesting (in this case this), it is time to take it spreadsheet app and edit it. Here we do not do any sophisticated editing but just take data as it. Then we build a chart based on that. Building a chart is done in Google spreadsheet with help of gadgets. Gadget is a term used by Google to express anything that can make use of data - like in this case a beautiful chart. So, we paint cells with content and right click with mouse. There we see a menu with "Insert a gadget" value. Once we have chosen that another menu with lots of gadgets is shown. Beauty Bar gadget is not yet in the menu, but needs to be written in custom gadget page. The location for gadget is http://beauty-bar.appspot.com/spreadsheet-gadget.xml. That opens a yet another menu where we can choose a style from few predefined styles or type a name of our custom style. Here we make style called findebt with Beauty Bar online tool and use it. Then just click Apply and finally the chart is shown. Nice.
No comments:
Post a Comment